import jsonRAG-Enhanced Question Answering for SEC-10K Filings
In this notebook, we implement and test a question-answering system that leverages our optimized RAG retrieval pipeline from the previous analysis. Building on our comprehensive evaluation of retrieval strategies, we now focus on the end-to-end performance of the system in answering specific financial questions.
Our previous evaluation demonstrated that a combination of hybrid search (with metadata filtering) and reranking produces the most effective retrieval results. This approach successfully addresses the challenge of maintaining global context (such as company names and reporting periods) that is often lost during standard chunking and embedding processes.
The question-answering system we develop here follows a straightforward but powerful approach:
- Process a user query
- Retrieve the most relevant document chunks using our optimized pipeline
- Inject these chunks into a carefully crafted prompt
- Generate an answer using a large language model (LLM)
We’ll test this system against our benchmarking dataset of financial questions, which provides a realistic evaluation of the system’s capabilities in extracting and synthesizing information from SEC filing reports.
For this initial implementation, we’ll focus on qualitative evaluation through manual inspection of the generated answers. This allows us to gain insights into the system’s strengths and weaknesses before developing more formal evaluation metrics. While future work will incorporate automated evaluation, it’s worth noting that the retrieval component—which we’ve already rigorously evaluated—represents the critical foundation of the system. Without effective retrieval of relevant context, even the most sophisticated LLM would be unable to provide accurate answers to specific financial questions.
Let’s begin by setting up our question-answering pipeline and examining its performance on real-world financial queries.
Pre-requisites: You need to have run the previous three notebooks before this one. Also make sure that you’ve added your OpenAI API key as an environment variable.
Setup
First let’s import the required libraries and define the best pipeline configuration to use.
The code developed for this section is stored in the src/rag module.
from src.rag.benchmark import display_benchmark_results, evaluate_best_pipeline
from src.rag.chatbot import create_rag_chatbot, rag_with_openai
Below we set the locations of the pipeline to use, benchmark dataset file, and output directory. For this analysis, we’ll use the retrieval pipeline that produced the best evaluation results. This pipeline consisted of:
- Late-binding chunking with maximum of 200 tokens
- Small embedding model (
bge-small-en-v1.5) - Use of hybrid search and reranking
RUN_DIR = "pipelines/run_20250314_220111/" # Update to match the run directory name created in notebook 3
CONFIG_NAME = "late_chunk200_bge-small-en-v1.5_no_tables/with_reranking_hybrid"  # Adjust to your best config
BENCHMARK_PATH = "./data/benchmark/benchmark_dataset_reviewed.json"
OUTPUT_DIR = "./outputs/llm_evaluation_results"
Benchmark question answering
Now we’ll run all the questions from the benchmark dataset through the best retrieval pipeline using the evaluate_best_pipeline function. Here we’ll pass the top 20 chunks to the LLM and ask it to answer the question based on this information. For this test we’ll use the OpenAI API.
Note: The gpt-4-turbo model is used below. Change this to gpt-4o-mini if you want to use a cheaper model.
# Run the evaluation with your best configuration
output_path = evaluate_best_pipeline(
    run_dir=RUN_DIR,
    config_name=CONFIG_NAME,
    benchmark_path=BENCHMARK_PATH,
    output_dir=OUTPUT_DIR,
    model="gpt-4-turbo",
    max_tokens=1000,
    temperature=0.0,
    top_k=20, # Will pass the top 20 chunks to the LLM
    initial_retrieval_multiplier=3
)
Display generated answers
Below the generated answers are compared to the answers included in the benchmark dataset.
display_benchmark_results(output_path)Benchmark Results Summary:
Model: gpt-4-turbo
Top-k: 20
Number of questions: 9
Total tokens used: 47413
Average processing time: 16.34 seconds
Question 1: d9fd9582-4495-4310-a142-8d3beb5e0d1e
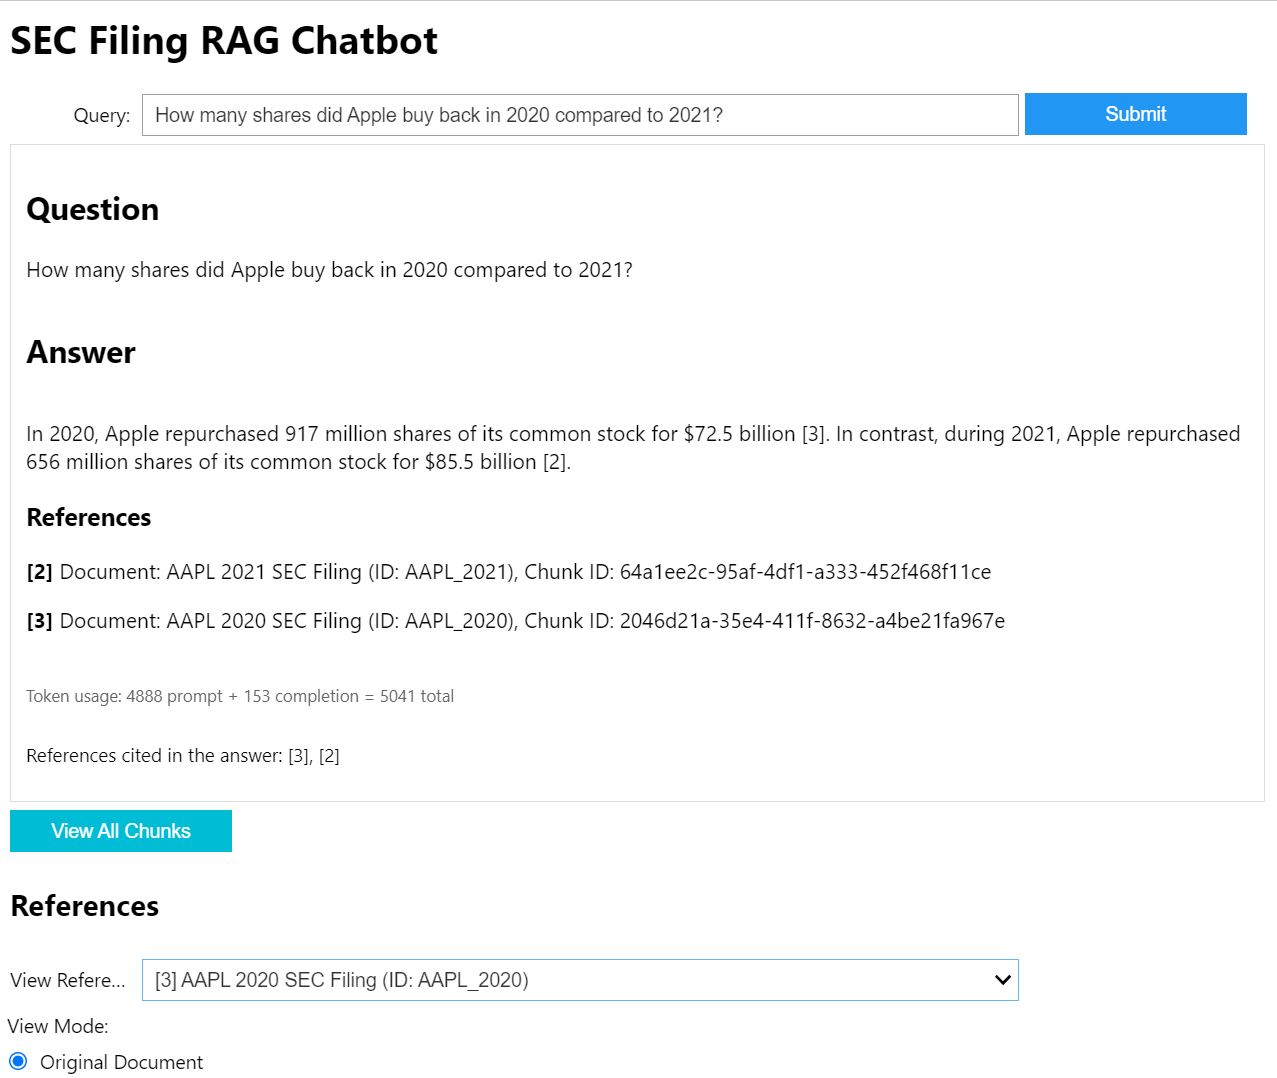
Question: How many shares did Apple buy back in 2020 compared to 2021?
Reference Answer:
In 2020, Apple repurchased 917 million shares of its common stock for $72.5 billion, while in 2021, the company repurchased $85.5 billion of its common stock.
Model Answer:
In 2020, Apple repurchased 917 million shares of its common stock for $72.5 billion [3]. In comparison, during 2021, Apple repurchased 656 million shares of its common stock for $85.5 billion [1].
References:
[1] Document: AAPL 2021 SEC Filing (ID: AAPL_2021), Chunk ID: 211cb98e-9903-4d68-ae90-90a4883f2e62
[3] Document: AAPL 2020 SEC Filing (ID: AAPL_2020), Chunk ID: 2046d21a-35e4-411f-8632-a4be21fa967e
References:
[1] Document: AAPL 2021 SEC Filing (ID: AAPL_2021), Chunk ID: 211cb98e-9903-4d68-ae90-90a4883f2e62
[3] Document: AAPL 2020 SEC Filing (ID: AAPL_2020), Chunk ID: 2046d21a-35e4-411f-8632-a4be21fa967e
Processing Time: 12.18 seconds
Total Tokens: 5042
Question 2: f8285225-6cf4-4984-b71c-510455c295cf
Question: How does Google manage the risks associated with fluctuations in foreign currency exchange rates and what were the potential impacts on their income before taxes for the years 2020 and 2021?
Reference Answer:
Google manages the risks associated with fluctuations in foreign currency exchange rates by using foreign exchange forward contracts and option contracts, including collars, to offset the foreign exchange risk on assets, liabilities, and forecasted U.S. dollar-equivalent earnings. These contracts reduce, but do not entirely eliminate, the effect of foreign currency exchange rate movements. For the years 2020 and 2021, if an adverse 10% foreign currency exchange rate change was applied to total monetary assets, liabilities, and commitments, it would have resulted in an adverse effect on income before income taxes of approximately $497 million and $285 million, respectively.
Model Answer:
Google manages the risks associated with fluctuations in foreign currency exchange rates through a foreign exchange risk management program that includes the use of foreign currency forwards and option contracts, including collars. This program is designed to reduce, but not entirely eliminate, the impact of foreign currency exchange rate movements on Google's assets, liabilities, and income [1][2][3][4][5][6][8][9][10][12].
The potential impacts of these fluctuations on Google's income before taxes for the years 2020 and 2021 were significant. If an adverse 10% foreign currency exchange rate change had occurred, it would have resulted in an adverse effect on income before income taxes of approximately $497 million for the year 2020 and $285 million for the year 2021, after considering the effect of foreign exchange contracts in place [2].
References:
[1] GOOG 2022 SEC Filing (ID: GOOG_2022), Chunk ID: ac4ddf68-5362-46bb-9d30-e59444af0433
[2] GOOG 2022 SEC Filing (ID: GOOG_2022), Chunk ID: e9838825-d133-48ff-b3a4-9af641d0c017
[3] GOOG 2022 SEC Filing (ID: GOOG_2022), Chunk ID: 881c2771-8f45-41ec-b484-b4bf1808357a
[4] GOOG 2021 SEC Filing (ID: GOOG_2021), Chunk ID: 4244f650-4539-478c-b0c6-3f6408c3b81e
[5] GOOG 2021 SEC Filing (ID: GOOG_2021), Chunk ID: ec1387c0-8d13-4523-83ee-a8b8dd87b7ba
[6] GOOG 2021 SEC Filing (ID: GOOG_2021), Chunk ID: c61b0066-6a68-4425-b24a-a7205b7141b9
[8] GOOG 2022 SEC Filing (ID: GOOG_2022), Chunk ID: 3a7af559-3840-4919-a21e-b75983f27f44
[9] GOOG 2021 SEC Filing (ID: GOOG_2021), Chunk ID: b86197e6-3c18-42d0-9c01-0164aed27235
[10] GOOG 2022 SEC Filing (ID: GOOG_2022), Chunk ID: a7bb584a-c343-456d-acbc-b11d7d72a110
[12] GOOG 2022 SEC Filing (ID: GOOG_2022), Chunk ID: 4e1551a0-483e-416a-9c05-bdb760a6255d
Processing Time: 22.09 seconds
Total Tokens: 5564
Question 3: 01e2d5d6-6b00-45d1-8657-7e85b859d4b8
Question: How did Apple's net sales change from 2018 to 2019, and what were the main drivers behind this change?
Reference Answer:
Apple's total net sales decreased by 2% or $5.4 billion during 2019 compared to 2018. This decline was primarily driven by lower net sales of iPhone, which was partially offset by higher net sales of Wearables, Home and Accessories, and Services in all geographic operating segments. The weakness in foreign currencies also had a significant unfavorable impact on net sales during 2019.
Model Answer:
Apple's net sales decreased by 2% or $5.4 billion in fiscal year 2019 compared to 2018. The primary drivers behind this change were:
1. **Decrease in iPhone Sales**: The most significant factor contributing to the decline in net sales was the decrease in iPhone sales. The lower iPhone unit sales were a major contributor to the overall reduction in net sales [1], [3].
2. **Increase in Other Product Categories**: This decrease was partially offset by increases in other areas. There was a rise in net sales of Wearables, Home and Accessories, driven primarily by higher sales of AirPods and Apple Watch [2], [3]. Additionally, the Services segment saw an increase, primarily due to higher net sales from the App Store, licensing, and AppleCare [2].
3. **Currency Fluctuations**: The weakness in foreign currencies relative to the U.S. dollar had a significant unfavorable impact on net sales in 2019. This currency effect negatively influenced net sales across various geographic segments including Europe, Greater China, and the Rest of Asia Pacific [1], [5].
4. **Geographic Performance Variations**: While there were increases in some geographic areas, these were not enough to offset the decreases in others. For instance, net sales in Greater China and Japan decreased primarily due to lower iPhone sales, despite increases in Services and Wearables, Home and Accessories sales [5].
These factors combined led to the overall decrease in Apple's net sales from 2018 to 2019.
References:
[1] Document: AAPL 2019 SEC Filing (ID: AAPL_2019), Chunk ID: 46ac772e-cb47-421b-a2a8-fbed8ac0d919
[2] Document: AAPL 2019 SEC Filing (ID: AAPL_2019), Chunk ID: a9881923-2fa7-4fee-83f3-e99774105303
[3] Document: AAPL 2019 SEC Filing (ID: AAPL_2019), Chunk ID: c65319f4-ef25-4692-96b0-7d4474907d19
[5] Document: AAPL 2019 SEC Filing (ID: AAPL_2019), Chunk ID: c09d9f31-cf4b-4f72-bdfe-be525c663f45
Processing Time: 20.69 seconds
Total Tokens: 5530
Question 4: f3f4f98c-c82e-4a68-85a1-de18787135a2
Question: How has NVIDIA's investment in research and development changed from 2016 to 2022?
Reference Answer:
NVIDIA's investment in research and development significantly increased from 2016 to 2022. In 2016, the company had invested $12 billion in research and development since its inception. By 2022, this investment had more than doubled, reaching over $29 billion.
Model Answer:
NVIDIA's investment in research and development (R&D) has shown significant growth from 2016 to 2022. Here is a summary of the R&D investments over these years:
- In 2016, NVIDIA invested $12 billion in R&D since its inception [3].
- By 2017, this investment increased to over $13 billion [2].
- In 2022, the cumulative R&D investment reached over $29 billion [4].
- By 2023, NVIDIA had invested over $37 billion in R&D since its inception [1].
This data indicates a substantial increase in R&D investment over the period, reflecting NVIDIA's ongoing commitment to innovation and development in its field.
References:
[1] NVDA 2023 SEC Filing (ID: NVDA_2023)
[2] NVDA 2017 SEC Filing (ID: NVDA_2017)
[3] NVDA 2016 SEC Filing (ID: NVDA_2016)
[4] NVDA 2022 SEC Filing (ID: NVDA_2022)
Processing Time: 15.29 seconds
Total Tokens: 5041
Question 5: cf1d017d-b6f2-48e2-b6a0-fad75fec4807
Question: How did the potential impact of a hypothetical 100 basis point increase in interest rates on Apple's investment portfolio change from 2018 to 2020?
Reference Answer:
In 2018, a hypothetical 100 basis point increase in interest rates would have resulted in a $4.9 billion decline in the fair market value of Apple's investment portfolio. By 2020, the impact of a similar increase in interest rates would have led to a $3.1 billion decline in the fair market value of the portfolio.
Model Answer:
The potential impact of a hypothetical 100 basis point increase in interest rates on Apple's investment portfolio changed as follows from 2018 to 2020:
- In 2018, a 100 basis point increase would have resulted in a $4.9 billion decline in the fair market value of the investment portfolio [3].
- In 2019, the impact of a 100 basis point increase would have resulted in a $2.8 billion decline in the fair market value of the investment portfolio [4].
- In 2020, the impact of a 100 basis point increase would have resulted in a $3.1 billion decline in the fair market value of the investment portfolio [1].
From 2018 to 2019, the potential impact decreased from $4.9 billion to $2.8 billion, indicating a reduced sensitivity to interest rate increases. However, from 2019 to 2020, the potential impact increased slightly from $2.8 billion to $3.1 billion.
References:
[1] AAPL 2020 SEC Filing (ID: AAPL_2020)
[3] AAPL 2018 SEC Filing (ID: AAPL_2018)
[4] AAPL 2019 SEC Filing (ID: AAPL_2019)
Processing Time: 15.40 seconds
Total Tokens: 5056
Question 6: dd218ea8-e6c1-432f-8194-c78beef2c044
Question: How did Microsoft calculate their annualized run rate in 2015, and what specific financial commitments did they exclude from their reported amounts?
Reference Answer:
In 2015, Microsoft calculated their annualized run rate by multiplying their June 2015 revenue by twelve months. They excluded long-term tax contingencies, other tax liabilities, deferred income taxes, and long-term pension liabilities totaling $15.2 billion from the reported amounts.
Model Answer:
Microsoft calculated their annualized run rate in 2015 by multiplying the revenue of June 2015 by twelve months [1]. This method projects the annual revenue based on the revenue of a single month, assuming that the revenue generation rate remains constant throughout the year.
From the reported financial commitments, Microsoft excluded several items. Specifically, they excluded long-term tax contingencies, other tax liabilities, deferred income taxes, and long-term pension liabilities totaling $15.2 billion [4]. Additionally, unearned revenue and non-cash items were also excluded from the reported amounts [4][6].
References:
[1] MSFT 2015 SEC Filing (ID: MSFT_2015), Chunk ID: 12f9a3d0-3026-4c1d-9c0c-f19dd8e266c6
[4] MSFT 2015 SEC Filing (ID: MSFT_2015), Chunk ID: 980aac15-7caf-42d2-87f9-ddc38bc3493d
[6] MSFT 2016 SEC Filing (ID: MSFT_2016), Chunk ID: 264bd0cf-58b2-49aa-9a41-2b3a129173d9
Processing Time: 15.39 seconds
Total Tokens: 5556
Question 7: 5fd570db-db81-4369-8f35-4aa13995654a
Question: How did the revenue growth rates of Google and NVIDIA compare in 2018?
Reference Answer:
In 2018, Google's revenue growth was 23% year over year, while NVIDIA's revenue growth was significantly higher at 41%. This indicates that NVIDIA outperformed Google in terms of revenue growth during that year.
Model Answer:
In 2018, Google's revenue growth rate was 23% [1], while NVIDIA's revenue growth rate was 41% [3]. Therefore, NVIDIA experienced a higher revenue growth rate compared to Google in that year.
References:
[1] Document: GOOG 2019 SEC Filing (ID: GOOG_2019), Chunk ID: f01ad5bc-8207-4a94-901a-4eb33a632560
[3] Document: NVDA 2018 SEC Filing (ID: NVDA_2018), Chunk ID: db204d56-5139-4f88-8a9d-e218d4e93899
References:
[1] Document: GOOG 2019 SEC Filing (ID: GOOG_2019), Chunk ID: f01ad5bc-8207-4a94-901a-4eb33a632560
[3] Document: NVDA 2018 SEC Filing (ID: NVDA_2018), Chunk ID: db204d56-5139-4f88-8a9d-e218d4e93899
Processing Time: 12.48 seconds
Total Tokens: 5092
Question 8: ed50c67e-ae38-47b7-9983-98e2af1d03eb
Question: How did NVIDIA's revenue growth in 2016 compare to 2021 compare, and what were the main drivers behind their revenue changes?
Reference Answer:
In 2016, NVIDIA's revenue grew 7% to a record $5.01 billion, driven by growth in GeForce GPUs for gaming and Tesla products for datacenter. In 2021, NVIDIA's revenue was $16.68 billion, marking a 53% increase from the previous year. The main drivers for NVIDIA's revenue growth were higher sales across desktop and laptop GPUs for gaming, and game-console SOCs, as well as the ramp of the NVIDIA Ampere GPU architecture and the inclusion of Mellanox revenue.
Model Answer:
NVIDIA's revenue growth from 2016 to 2021 showed a significant increase. In 2016, NVIDIA's revenue was $5.01 billion, marking a 7% growth from the previous year [1]. By 2021, the revenue had surged to $16.68 billion, representing a 53% increase from the previous year [4].
The main drivers behind these revenue changes include:
1. **GPU Revenue Growth**: In 2016, the GPU revenue increased by 9% primarily due to growth in GeForce GPUs for gaming and Tesla products for data centers [1]. By 2021, the growth in the Graphics segment was 29%, driven by GeForce GPUs and game console SOCs [3].
2. **Data Center Expansion**: A significant boost in 2021 revenue came from the Data Center segment, which saw a 124% increase. This growth was fueled by the Mellanox acquisition and the ramp-up of the NVIDIA Ampere GPU architecture [2].
3. **Acquisitions and New Technologies**: The acquisition of Mellanox in 2020 significantly contributed to the revenue in 2021, with Mellanox revenue accounting for 10% of the total company revenue [2]. The introduction of new GPU architectures and expansion into new product areas also played crucial roles.
4. **Diverse Segment Performance**: While some segments like Automotive and Professional Visualization saw declines due to specific market conditions such as COVID-19 impacts and shifts in product demand, others like OEM and Other revenue grew by 25% in 2021, primarily due to higher volume of entry-level laptop GPUs [2].
Overall, NVIDIA's strategic acquisitions, expansion into new markets, and continuous innovation in GPU technologies were key factors driving the substantial revenue growth from 2016 to 2021.
References:
[1] NVDA 2016 SEC Filing (ID: NVDA_2016)
[2] NVDA 2021 SEC Filing (ID: NVDA_2021)
[3] NVDA 2021 SEC Filing (ID: NVDA_2021)
[4] NVDA 2021 SEC Filing (ID: NVDA_2021)
Processing Time: 19.21 seconds
Total Tokens: 5257
Question 9: 7fc75be9-52fa-42f2-ba72-8a0107e5eb42
Question: How did the number of shareholders of record for Apple change from 2017 to 2019?
Reference Answer:
The number of shareholders of record for Apple decreased from 25,333 in 2017 to 23,233 in 2019.
Model Answer:
The number of shareholders of record for Apple Inc. changed as follows from 2017 to 2019:
- In 2017, there were 25,333 shareholders of record [1].
- In 2018, the number of shareholders decreased to 23,712 [5].
- By 2019, the number further decreased to 23,233 shareholders of record [2].
This indicates a gradual decrease in the number of shareholders of record over the three-year period from 2017 to 2019.
References:
[1] AAPL 2017 SEC Filing (ID: AAPL_2017)
[2] AAPL 2019 SEC Filing (ID: AAPL_2019)
[5] AAPL 2018 SEC Filing (ID: AAPL_2018)
Processing Time: 14.35 seconds
Total Tokens: 5275
Analysis of outputs
Our manual inspection of the RAG-enhanced question answering system reveals promising results with some areas for improvement:
Strengths
- High Accuracy: The system successfully answers all benchmark questions, covering the key details present in the reference answers.
- Comprehensive Responses: Generated answers often provide more comprehensive information than the reference answers, including relevant contextual details.
- Effective Retrieval: The combination of hybrid search (with metadata filtering) and reranking successfully retrieves the relevant context needed to answer specific financial questions.
Areas for Improvement
Some minor issues remain in the generated reponses, which may be the focus in future iterations. These include:
- Year Comparison Precision: When asked to compare specific years (e.g., 2016 vs. 2021), the system sometimes includes data from intermediate years. This is likely due to our metadata filtering approach, which includes the subsequent year to capture reports that might contain relevant information about the requested year.
- Reference Numbering: The current reference numbering system is based on retrieved chunk numbers rather than the order in which they appear in the answer. Implementing consecutive numbering starting from [1] would improve readability and citation clarity.
- Answer Conciseness: While comprehensive answers are valuable, there may be cases where more concise responses would better serve user needs. Future improvements could focus on balancing completeness with brevity.
Next Steps
The next steps may include:
- Refining the metadata filtering approach to be more precise with year comparisons while maintaining recall
- Implement post-processing to renumber references consecutively based on their appearance in the answer
- Consider adding automated evaluation metrics to complement manual inspection
- Explore prompt engineering techniques to guide the model toward more concise answers when appropriate
Overall, the RAG system demonstrates strong performance in answering complex financial questions, with the identified improvements representing refinements to an already effective approach.
Chatbot tool
A basic chatbot interface that can be run within the notebook is also included. This allows you to inspect the references and check that they are actually from the source document.
create_rag_chatbot(
    run_dir=RUN_DIR,
    config_name=CONFIG_NAME,
    model='gpt-4-turbo',
    top_k=20
)
Summary
Overall, the RAG system demonstrates strong performance in answering complex financial questions, with the identified improvements representing refinements to an already effective approach.