Hosted with nbsanity. See source notebook on GitHub.

Polars vs Pandas

03 04 24


Comparing Polars and Pandas packages for loading and transforming data

import polars as pl
import pandas as pd

import matplotlib.pyplot as plt
import seaborn as sns

from time import time

sns.set()
%matplotlib inline

Load data

data_folder = '/Users/alexlee/Desktop/Data'
filename_gnaf = f'{data_folder}/geo/gnaf_feb2024/GNAF_CORE.psv'
filename_gnaf_parquet = f'{data_folder}/geo/gnaf_feb2024/GNAF_CORE.parquet'
gnaf = pd.read_csv(filename_gnaf, sep='|')
gnaf.shape
(15608317, 27)

Queries

Pandas

How many addresses for each street in postcode 3000?

# filter to postcode 3000
gnaf_melbourne = gnaf[gnaf['POSTCODE'] == 3000]

# count the number of addresses per street in postcode 3000
melbourne_street_counts = gnaf_melbourne.groupby('STREET_NAME').size()

# sort the data in descending order by the number of addresses
melbourne_street_counts.sort_values(ascending=False)
STREET_NAME
LONSDALE           11138
ABECKETT           10538
COLLINS            10066
LITTLE LONSDALE     9718
LA TROBE            7462
                   ...  
RUTLEDGE               1
HEAPE                  1
HARWOOD                1
RACING CLUB            1
DOMAIN                 1
Length: 165, dtype: int64
gnaf.query('POSTCODE == 3000').groupby('STREET_NAME').size().sort_values(ascending=False)
STREET_NAME
LONSDALE           11138
ABECKETT           10538
COLLINS            10066
LITTLE LONSDALE     9718
LA TROBE            7462
                   ...  
RUTLEDGE               1
HEAPE                  1
HARWOOD                1
RACING CLUB            1
DOMAIN                 1
Length: 165, dtype: int64
(
    gnaf
    .query('POSTCODE == 3000')
    .groupby('STREET_NAME')
    .size()
    .sort_values(ascending=False)
)
STREET_NAME
LONSDALE           11138
ABECKETT           10538
COLLINS            10066
LITTLE LONSDALE     9718
LA TROBE            7462
                   ...  
RUTLEDGE               1
HEAPE                  1
HARWOOD                1
RACING CLUB            1
DOMAIN                 1
Length: 165, dtype: int64

What is the distribution of starting letters for streets in NSW?

(
    gnaf
    .query('STATE == "NSW"')
    .STREET_NAME
    .str.slice(0, 1)
    .value_counts()
)
STREET_NAME
B    500267
C    467428
M    426049
S    326787
P    299393
W    296203
H    258910
G    250268
A    220864
R    217310
T    213359
L    196466
D    181450
K    167153
F    161510
E    143570
N    121485
O    119007
J     86372
V     68137
I     37394
Y     36899
Q     26382
U     22352
Z      2993
X       123
4        21
Name: count, dtype: int64

Polars

gnaf = pl.read_csv(filename_gnaf, separator='|', infer_schema_length=10000)
gnaf.shape
(15608317, 27)
(
    gnaf
    .filter(pl.col("POSTCODE") == 3000)
    .group_by("STREET_NAME")
    .len()
    .sort('len', descending=True)
)
shape: (165, 2)
STREET_NAME len
str u32
"LONSDALE" 11138
"ABECKETT" 10538
"COLLINS" 10066
"LITTLE LONSDAL… 9718
"LA TROBE" 7462
"WELLINGTON" 1
"RUTLEDGE" 1
"ACDC" 1
"CHURCH" 1
"BROWN" 1
(
    gnaf
    .filter(pl.col('STATE') == "NSW")
    .select(pl.col("STREET_NAME"))
    .with_columns(pl.col("STREET_NAME").str.slice(0, 1).alias("letter"))
    .group_by('letter')
    .count()
    .sort('count', descending=True)
)
/var/folders/7h/4cq59zrd6vb2jqwxh3wdk3nw0000gn/T/ipykernel_2994/1041641723.py:7: DeprecationWarning: `count` is deprecated. It has been renamed to `len`.
  .count()
shape: (27, 2)
letter count
str u32
"B" 500267
"C" 467428
"M" 426049
"S" 326787
"P" 299393
"Q" 26382
"U" 22352
"Z" 2993
"X" 123
"4" 21

Speed comparison

Loading data in Polars vs Pandas

# polars
t1 = time()
gnaf = pl.read_csv(filename_gnaf, separator='|', infer_schema_length=10000)
t2 = time()
print(t2-t1)

# pandas
t1 = time()
gnaf = pd.read_csv(filename_gnaf, sep='|')
t2 = time()
print(t2-t1)
4.853427886962891
39.20191216468811
gnaf_polars = pl.read_csv(filename_gnaf, separator='|', infer_schema_length=10000)
gnaf_pandas = pd.read_csv(filename_gnaf, sep='|')

Comparing the speed of some simple queries

# polars
t1 = time()
(
    gnaf_polars
    .filter(pl.col('STATE') == "NSW")
    .select(pl.col("STREET_NAME"))
    .with_columns(pl.col("STREET_NAME").str.slice(0, 1).alias("letter"))
    .group_by('letter')
    .count()
    .sort('count', descending=True)
)
t2 = time()
print(t2-t1)

# pandas
t1 = time()
(
    gnaf_pandas
    .query('STATE == "NSW"')
    .STREET_NAME
    .str.slice(0, 1)
    .value_counts()
)
t2 = time()
print(t2-t1)
/var/folders/7h/4cq59zrd6vb2jqwxh3wdk3nw0000gn/T/ipykernel_2994/2471861764.py:9: DeprecationWarning: `count` is deprecated. It has been renamed to `len`.
  .count()
3.8098649978637695
3.2129640579223633
# polars
t1 = time()
(
    gnaf_polars
    .filter(pl.col("POSTCODE") == 3000)
    .group_by("STREET_NAME")
    .len()
    .sort('len', descending=True)
)
t2 = time()
print(t2 - t1)

# pandas
t1 = time()
results = (
    gnaf_pandas
    .query('POSTCODE == 3000')
    .groupby('STREET_NAME')
    .size()
    .sort_values(ascending=False)
)
t2 = time()
print(t2-t1)
2.3313450813293457
1.1500351428985596

Loading parquet files

# load in pandas
t1 = time()
gnaf = pd.read_parquet(filename_gnaf_parquet)
t2 = time()
print(t2-t1)

# load in polars
t1 = time()
gnaf = pl.read_parquet(filename_gnaf_parquet)
t2 = time()
print(t2-t1)
26.306514978408813
16.54242491722107

Lazy evaluation

gnaf = pl.scan_parquet(filename_gnaf_parquet)
t1 = time()
(
    gnaf
    .filter(pl.col("POSTCODE") == 3000)
    .group_by("STREET_NAME")
    .len()
    .sort('len', descending=True)
    .collect()
)
t2 = time()
print(t2 - t1)
0.11325383186340332
t1 = time()
(
    gnaf
    .filter(pl.col('STATE') == "NSW")
    .select(pl.col("STREET_NAME"))
    .with_columns(pl.col("STREET_NAME").str.slice(0, 1).alias("letter"))
    .group_by('letter')
    .len()
    .sort('len', descending=True)
    .collect()
)
t2 = time()
print(t2-t1)
0.19588303565979004

Larger than memory datasets

from os import listdir
nyc_folder = '/Users/alexlee/Desktop/Data'

filenames_nyc = f'{data_folder}/test_data/nyc_taxi'
all_files = listdir(filenames_nyc)
all_files = sorted(all_files)
# column names of 2023 data so that they match the previous years
for filename in all_files[-11:]:
    print(filename)
    nyc_data = pl.read_parquet(f'{filenames_nyc}/{filename}').rename({'Airport_fee': 'airport_fee'})
    nyc_data.write_parquet(f'{filenames_nyc}/{filename}')
# consider only data from 2011 as the format changed

# ensure that the columns of all files are the data types
# probably not the best way of doing this
for filename in all_files:
    nyc_data = pl.scan_parquet(f'{filenames_nyc}/{filename}')
    nyc_data.select(
        pl.col('VendorID').cast(pl.Int64),
        pl.col('tpep_pickup_datetime').cast(pl.Datetime),
        pl.col('tpep_dropoff_datetime').cast(pl.Datetime),
        pl.col('passenger_count').cast(pl.Int64),
        pl.col('trip_distance').cast(pl.Float64),
        pl.col('RatecodeID').cast(pl.Int64),
        pl.col('store_and_fwd_flag').cast(pl.String),
        pl.col('PULocationID').cast(pl.Int64),
        pl.col('DOLocationID').cast(pl.Int64),
        pl.col('payment_type').cast(pl.Int64),
        pl.col('fare_amount').cast(pl.Float64),
        pl.col('extra').cast(pl.Float64),
        pl.col('mta_tax').cast(pl.Float64),
        pl.col('tip_amount').cast(pl.Float64),
        pl.col('tolls_amount').cast(pl.Float64),
        pl.col('improvement_surcharge').cast(pl.Float64),
        pl.col('total_amount').cast(pl.Float64),
        pl.col('congestion_surcharge').cast(pl.Float64),
        pl.col('airport_fee').cast(pl.Float64)
    ).collect().write_parquet(f'{filenames_nyc}/{filename}')
# load the data folder
nyc_taxis = pl.scan_parquet(f'{filenames_nyc}/*.parquet')
# how many rows in the data?
nyc_taxis.select(pl.len()).collect()
shape: (1, 1)
len
u32
1397171103
# what is the max fare?
nyc_taxis.select(pl.max('fare_amount')).collect()
shape: (1, 1)
fare_amount
f64
998310.03
# what is the average fare?
nyc_taxis.select(pl.mean('fare_amount')).collect()
shape: (1, 1)
fare_amount
f64
12.433398
# what is the median fare?
nyc_taxis.select(pl.median('fare_amount')).collect()
shape: (1, 1)
fare_amount
f64
9.0
# what is the distribution of passenger counts?
nyc_taxis.group_by('passenger_count').len().sort('len', descending=True).collect().head(10)
shape: (10, 2)
passenger_count len
i64 u32
1 981235169
2 201096537
5 74997895
3 58829131
6 38145225
4 28369915
0 9021642
null 5469148
7 2438
8 2073
nyc_taxis.columns
['VendorID',
 'tpep_pickup_datetime',
 'tpep_dropoff_datetime',
 'passenger_count',
 'trip_distance',
 'RatecodeID',
 'store_and_fwd_flag',
 'PULocationID',
 'DOLocationID',
 'payment_type',
 'fare_amount',
 'extra',
 'mta_tax',
 'tip_amount',
 'tolls_amount',
 'improvement_surcharge',
 'total_amount',
 'congestion_surcharge',
 'airport_fee']
# how many different pickup locations are there?
nyc_taxis.group_by('PULocationID').len().collect()
shape: (265, 2)
PULocationID len
i64 u32
140 23757796
161 50241528
6 6851
146 1590748
30 887
232 2785351
229 27277422
238 24580042
250 52011
104 201
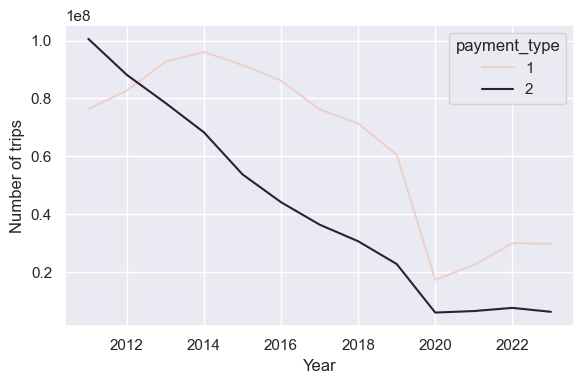
# let's see how people are paying over time
payment_types_year = (
    nyc_taxis
    .with_columns(pl.col('tpep_pickup_datetime').dt.year().alias('pickup_year'))
    .group_by(pl.col(['pickup_year', 'payment_type']))
    .len()
    .filter(pl.col('pickup_year').is_in(list(range(2011,2024))))
    .filter(pl.col('payment_type').is_in([1,2]))
    .sort(pl.col('pickup_year'))
    .collect()
)
plt.figure(figsize=(6, 4))
sns.lineplot(data=payment_types_year.to_pandas(), x='pickup_year', y='len', hue='payment_type')
plt.xlabel('Year')
plt.ylabel('Number of trips')
plt.tight_layout()
plt.savefig('payments_over_time_nyc_taxis.png')